Introduction
A Vt graph is a two-dimensional representation of velocity versus time, where the velocity of the object in question is on the y-axis and the time taken into consideration is on the x-axis. There are other kinds of graphs, such as speed-time, displacement-time, and acceleration-time graphs. The slope of a displacement-time graph and the area under the acceleration-time graph give us the velocity.
The Slope of a Vt Graph
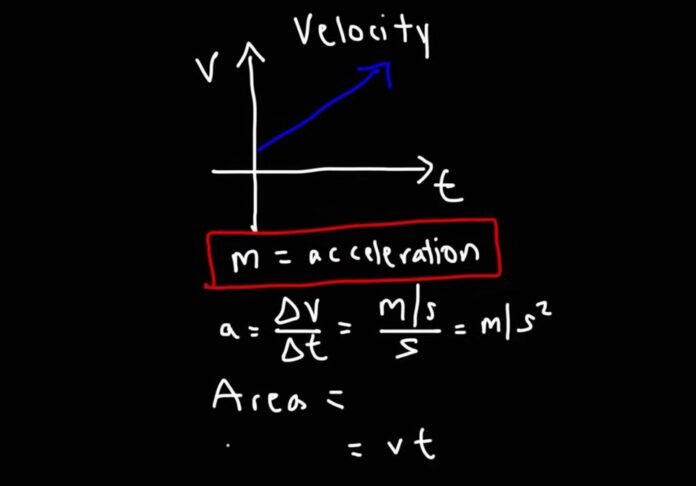
The slope of a Vt graph represents the acceleration of the object. The acceleration is the rate of change of velocity. The rate of change from the y-axis to the x-axis is just the slope of the graph. Hence, we denote the acceleration as the slope of the Vt graph.
The Vt graph has various significances, but determining the acceleration or the sign of the acceleration is the most important one. One can do that by observing the slope. A positive slope of the graph implies that the acceleration of the body is positive, and a negative slope implies that the acceleration of the body is also negative.
We can determine if the acceleration of the body is constant from the slope itself. If the slope of the graph is stable, it is a straight line. The acceleration of the object is uniform too. If the gradient is not constant and is changing, that is, if the graph is a parabola, we find that the acceleration is altering.
Vt Graphs of Various Cases
When the velocity is constant
When the velocity of the object in question is constant, and the x-axis has the time component, the graph is a straight line parallel to the x-axis. Thus, the slope of the graph is zero, which also means that the acceleration is zero. In this case, acceleration is zero because the velocity is constant, and acceleration is just the rate of change of velocity to time, which is zero here. And the area under the graph here is the displacement, which turns out to be a simple rectangle.
When the velocity is constantly changing at a constant rate
When the rate at which the displacement changes is altering, at a constant rate, the graph turns out to be a straight line passing through the origin. Here, the shift in velocity at a consistent rate means that the velocity is increasing or decreasing with a constant amount concerning time, and this consistent amount is called acceleration. And here, the acceleration of the object in question is consistent with time, and we can calculate by measuring the slope of the Velocity-time graph.
The Formula for the Vt Graph
The formulas for the Vt graph include the slope calculator formula, which gives us the acceleration, and the area calculator formula, which calculates the area under the Vt graph.
Recommended Articles:
Wave Function – Definition, Equation, Function and Mechanics
Wave Theory Of Light – History, Theory, Principle & Types
Waves I Definition, Types, Characteristics and Properties
Weathering Types I Physical, Chemical & Biological
What are Eddy Currents? Definition, Used and Systems
Yes, it can be, as graphs are just depictions of the data. But usually, we prefer the case of velocity on the y-axis and time on the x-axis. It is because it's a convention to do so. And also because several problems and derivations are all based on this way of representation of the Vt graph. However, the converse is also possible. One can find the displacement by finding the area under the Vt graph and the distance by finding the area under the speed-time graph. But the area under the velocity-time graph sometimes equals the distance covered by the object. That is, the distance covered equals the displacement. This can only happen when the body travels in a straight line. When an object has varying acceleration, its two-dimensional representation is not a straight line. Acceleration is the rate of change of velocity, and if the velocity is not changing at a constant rate, that implies that it is either exponentially increasing or decreasing, as exponential means a non-constant rate of change. And hence the graph, when the acceleration of an object is not constant, it looks like a parabola. The slope of the distance-time graph means speed and the displacement-time two-dimensional depiction means velocity. The area under the distance and displacement time graphs and the gradient of the acceleration-time graph have no significant meaning. Finally, the area under the speed-time graph means distance, and that of velocity-time implies displacement. And the slope of the velocity-time graph means acceleration. Complex integration calculates the area under the graph. When the two-dimensional representations are simple, such as the straight line ones, we can directly calculate it by measuring the area between the line and the x-axis, which is the area under the graph, which is usually a rectangle or a triangle, or a combination of them both. What is Vt Graphs? Names FAQs
Can velocity be present on the x-axis and time on the y-axis?
Can we find the distance covered by the object from the given Vt graph?
What does a graph of an object with changing acceleration look like?
What do the slopes and areas under the various graphs mean?
How does one calculate the area under the graph?
