Acceleration time graph-
The acceleration time graph depicts the relation between acceleration and time for a particle moving in a straight line. Acceleration vs time graph is an effective method to determine the change in velocity over a time period.
How to plot the Acceleration time graph?
- In the acceleration graph, the independent variable- acceleration is plotted on the y-axis, and the dependable variable- time is plotted on the x-axis.

- Acceleration ( independent variable) ( unit = m/sec^2) in the y-axis.
- Time ( dependent variable) ( unit = seconds) in the x-axis.
What does the slope of the Acceleration time graph represent?
- The slope of the acceleration time graph represents – Jerk
- Jerk (symbol j) is the rate of change of acceleration with respect to time. The SI unit of jerk is m/s3.
What does the area under the Acceleration time graph signify?
- The area under the acceleration vs time graph represents the change in velocity ( ∆v ). In other words, the change in velocity in a particular interval of time is the area under the acceleration- time graph for the same interval of time.
- Area = ∆v
- Derivation-
As we all know,
Area under the graph (A)= ∫a.dt (equation 1)
And a= dv/dt
So, dv= a.dt (equation 2)
From equation-1 and equation-2 we get –
A= ∫dv ( integrating from v1 and v2)
A= v2 -v1
A= Δv
Where, A= area under the graph
a = acceleration
Δv= change in velocity
Δt= change in time
Examples ( Acceleration- Time graph)
Example 1
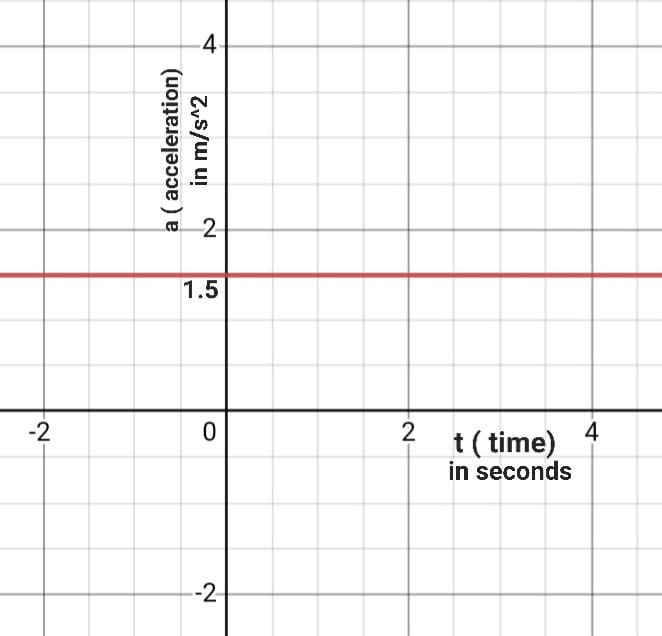
Q- Determine velocity at t= 6 seconds if the velocity at t= 0 was 0 using the acceleration time graph given below.

A- as we all know
a= dv/dt
dv= a.dt
Integrating both the sides
∫dv= ∫a,dt
v= ∫(1,5)dt
v(t)= 1.5t + c
Where C is a constant
v (at t=0)= 0
Therefore, c=0
v(t)= 1.5t
v( at t=6)= 1.5 X 6
v= 9 m/s ( at t= 6 seconds)
Example 2
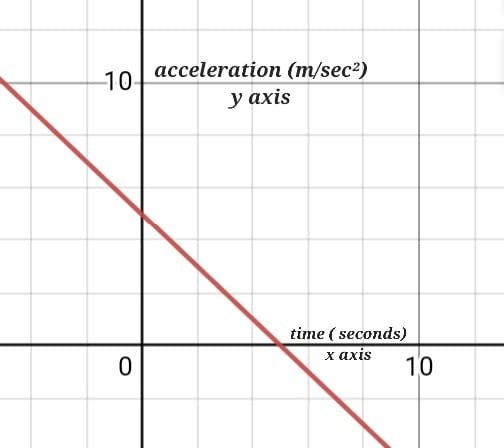
Q- The initial velocity of a truck is 20m/sec at time 0 seconds, the time acceleration graph below shows the acceleration of the truck. Find the final velocity (vf) of the truck.

A-
To find out the change in velocity we will calculate the area under the curve
- Area = ∆v = (½) (6 m/s^2) ( 8 sec)
∆v = 24m/s
As we all know that the change in velocity is the final velocity minus the initial velocity
Δv= vf- vi
Putting in the values
24 m/sec = vf- 20 m/sec
vf= 44 m/sec
The final velocity of the truck will be = 44m/sec
Conclusion –
The acceleration time graph depicts the relation between acceleration and time for a particle moving in a straight line. The area under the acceleration time graph will give us a change in velocity, to calculate the change in velocity between two points you have to connect those two points with the x-axis using vertical lines and then find out the area of the newly formed quadrilateral/ triangle. Also, the slope of acceleration vs time graph gives a quantity known as a jerk. A jerk is a change in acceleration of any object, in simple words jerk is a sudden change in acceleration that generally lasts for a small period. One example is the palm of a bowler while bowling in cricket. Convert the given quantities like velocity, acceleration, and time into the correct units before applying them in a formula.
Recommended Articles:
Acceleration Inclined Plane: Introduction, Laws and Calculating
AC Voltage Resistor – Introduction, Differences and Types
AC Voltage Inductor – Introduction, Work, Applications and Types
AC Voltage Capacitor – Introduction, Derivation and Applications
AC Voltage across LCR – Factors, Frequency, Values, Phase and Applications
To Find The Surface Tension Of Water By Capillary Rise Method
The acceleration vs time graph is a graph that depicts the relation between acceleration and time for an object moving in a straight line. Acceleration vs time graph is an effective method of calculating the change in velocity (Δv- by calculating the area under the graph) and the jerk ( j - by calculating the slope of the graph) Plot the independent variable- acceleration on the y-axis and the dependent variable- time on the x-axis. Then match all the changes in acceleration in different time intervals to form a graph. The acceleration vs time graph can ells us about the variation of velocity of an object. The slope of the acceleration time graph tells us about the jerk. The area under the acceleration graph gives us the change in velocity (Δv). Acceleration Time Graph FAQs
What is the acceleration- time graph?
What is the use of an acceleration time graph?
How to plot acceleration time graphs?
What does the acceleration time graph tell us about?
The slope of the acceleration time graph tells us about?
The area under the curve of the acceleration time graph gives?